Returns the variance of a population represented by a series of non-blank values in a field.
VarianceP(field{;field...})field - any related field, repeating field, or set of non-repeating fields; or an expression that returns a field, repeating field, or set of non-repeating fields.
Parameters in braces { } are optional.
number
FileMaker Pro 7.0
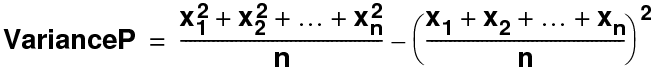
The variance of a population distribution is a measure of how spread out the distribution is. Field can be any of the following:
•a repeating field (repeatingField).
•a field in matching related records specified by (table::field), whether or not these records appear in a portal.
•several non-repeating fields in a record (field1;field2;field3...).
•corresponding repetitions of repeating fields in a record (repeatingField1;repeatingField2;repeatingField3), if the result is returned in a repeating field with at least the same number of repeats.
•several fields in the first matching record specified by (table::field1;table::field2;...). You can include fields from different tables (table 1::field A;table 2::field B...).
A portal displays the related values 5, 6, 7, and 8 in Scores.
VarianceP(table::Scores) returns 1.25.
In the following examples:
•Field1 contains two repetitions with values of 1 and 2.
•Field2 contains four repetitions with values of 5, 6, 7, and 8.
•Field3 contains four repetitions with values of 6, 0, 4, and 4.
•Field4 contains one repetition with a value of 3.
VarianceP(Field4) results in an error since the variance of a single value is not defined.
VarianceP(Field1;Field2;Field3) returns 4.66666666..., 6.22222222..., 2.25, 4 if the calculation is a repeating field.
Two classes of students take an exam. Class 1 has scores of 70, 71, 70, 74, 75, 73, 72 and Class 2 has scores of 55, 80, 75, 40, 65, 50, 95. The population variance for each class is:
Class 1: 3.26530612...
Class 2: 310.20408163...
The population variance for Class 1 is much lower than the population variance for Class 2 because the scores for Class 1 are more tightly clustered.