Creating quick charts
You can create and print a quick chart in Browse mode. When you start in Browse mode, FileMaker Pro sets up the chart based on the:
Quick charts work best for column, bar, pie, line, and area charts, which have a single data series on one axis and one or more data series on the other axis.
To learn about quick charting by stepping through an example, see Example 1: Charting summary data or the FileMaker Pro Tutorial.
|
2.
|
|
3.
|
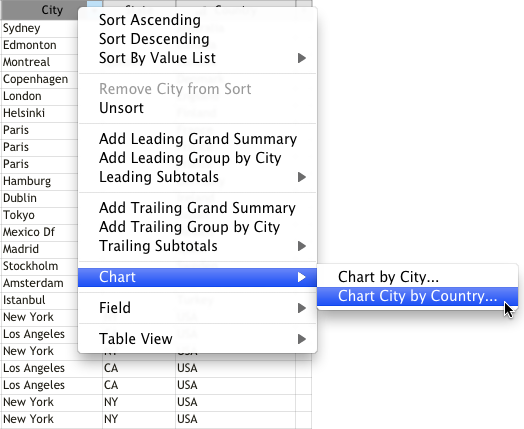
Use Table View to sort data. (Right-click or Control-click a column and choose a sorting option from the shortcut menu.) Quick charting uses the first sort field to group and summarize the data in the chart. Consider adding groups or summaries if those are the data points you intend to chart. See Working with data in Table View and Creating dynamic reports in Table View.
|
FileMaker Pro chooses an appropriate summary type based on the active field.
|
Plot data from the current column in groups based on the sort order
|
The Chart Setup dialog box appears. When you chart data in Table View, FileMaker Pro uses the current state of the file and the context of your selection to estimate chart settings. Depending on the complexity of your data set and the chart type you choose, you might need to use the Chart Setup dialog box to make adjustments to a quick chart.
You can change settings in the Chart inspector on the right to modify the chart. The preview helps you work efficiently in the Chart Setup dialog box. See Using the chart preview.
Note FileMaker Pro charts records in the Found Set by default. To change the source of the data that you are charting, click Data Source in the Chart inspector and for Chart Data choose Current Record (delimited data) or Related Records. See Specifying the data source for a chart
|
Choose a chart type and specify the data series
|
See Column, bar, line, and area charts (including stacked column and bar and positive/negative charts), Pie charts, or Scatter and bubble charts.
Note You can begin a scatter or bubble chart as a quick chart, but you will need to modify chart settings in the Chart Setup dialog box.
|
|
Change data labels, show or hide tick marks and set tick mark scale (if applicable), and format data
|
|
|
Change the color scheme, legend, or fonts in the chart
|
|
|
Specify the type of data the chart uses (records in the found set, delimited records, or related records)
|
|
6.
|
If your chart contains summary data, you can click the Summary menu in the Chart inspector and select a different summary type. See Summary types for charts.
|
|
Save the chart on a new layout
|
|
|
Access the chart later via the Layout pop-up menu
|
If you leave Include in layout menus selected, you can use Layouts menu > Go To Layout or the Manage Layouts dialog box to display the chart in layout mode. See Managing layouts.
|
Note If FileMaker Pro needs to create a summary field for the chart, the summary field is added to the current table when you save the chart on a layout. If you print the chart and do not save it on a layout, FileMaker Pro does not create the summary field in the database.
|
8.
|
If you choose not to save the chart after printing, click Cancel to close the Chart Setup dialog box.
|